The Research Question
Does the Metropolitan Museum of Art disproportionately acquire works by Black North American artists decades after their creation, suggesting delayed institutional recognition?

Our Hypotheses
Null Hypothesis: There is no significant relationship between the Civil Rights Era and the discrepancy between artwork creation date and Met acquisition date.
Alternative Hypothesis: As we move from 1865 → present across civil rights eras, the discrepancy between date created and date added to the Met significantly decreases, reflecting increasingly inclusive acquisition practices.
The Data Set
To build our dataset, we collected approximately 500 works by Black North American artists from the Metropolitan Museum of Art’s online collection database. For each artwork, we recorded key variables including the artwork title, artist, date created, date added to the Met, classification, and acquisition information. We then calculated the difference between the creation date and acquisition date in order to measure acquisition delay, which served as our primary indicator of institutional recognition. After organizing the data chronologically and by major historical eras, we used statistical analysis and digital visualizations to identify long-term patterns in the Met’s collecting practices over time.

Accumulation of Data
The Index of Black Artists of North America is a research aid created by the Metropolitan Museum of Art that was originally published in 2021. They tell readers, “Please note that this index is in continuous development and is not a comprehensive list of all Black artists represented in the Met libraries”. Thus, our project will not be a study of all black artists represented in the Met but it will show general trends relating to our research question through the investigation of 500 works.
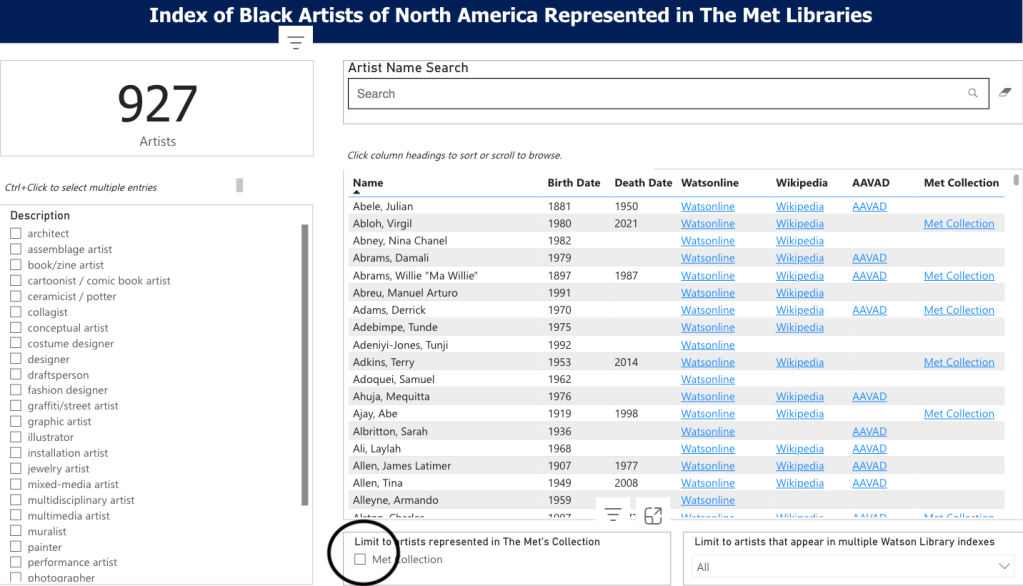
The index provided lists 927 Black artists in the Metropolitan Museum of Art’s research index, but only 245 of those artists are represented in the museum’s actual collection (accessible through the toggle button circled on the bottom left of the spreadsheet). This difference shows that the Met has documented and researched many more Black artists than it has formally acquired works from, reflecting historical gaps in museum collecting practices. When analyzing the spreadsheet, the lower number is especially important because it represents the artists the museum considered significant enough to include in its permanent holdings.
Because our research question focused on how and when the Metropolitan Museum of Art acquired works by Black artists, we used the smaller group of 245 artists represented in the Met’s collection rather than the full index of 927 artists. Since our analysis examined acquisition patterns and timelines, it was necessary to focus only on artists whose works had formally entered the Met’s permanent collection through donation, purchase, or other acquisition methods.
It is also important to distinguish between donated and purchased works: donated works often reflect the interests of private collectors or foundations, while purchased works show direct institutional investment and can indicate a more intentional effort by the museum to expand representation of Black artists.
What We Found
A Slope of -0.652
Our regression analysis produced a slope of −0.652, meaning that for each later year in the timeline, the average acquisition delay decreases by about 0.65 years. This negative slope demonstrates a clear downward trend in acquisition latency over time, suggesting that artworks by Black North American artists have been entering the Met collection more quickly in recent historical eras.
R-value of -0.796
Our regression analysis produced an r-value of −0.796, indicating a very strong negative correlation between historical era and acquisition delay. This means that as the timeline moves closer to the present, the gap between an artwork’s creation and its acquisition by the Met consistently decreases, suggesting increasingly rapid institutional recognition over time.
A T-Value of -29.3
Our analysis produced a t-value of −29.3, indicating an extremely strong negative relationship between historical era and acquisition delay. Because this value is far beyond the typical threshold for statistical significance, it provides strong evidence that the decreasing acquisition gap over time is not random and reflects a meaningful historical trend in the Met’s collecting practices.
A P-Value of 2.42 × 10⁻¹¹⁰
Our statistical analysis produced an extremely small p-value (2.42 × 10⁻¹¹⁰), indicating that the relationship between historical era and acquisition delay is highly statistically significant. This means the decreasing gap between artwork creation dates and Met acquisition dates is extremely unlikely to have occurred by random chance, providing strong evidence that institutional collecting practices changed over time.
Interpretation of the Data
Together, these findings suggest that the Metropolitan Museum of Art historically acquired works by Black North American artists long after their creation, especially during earlier periods marked by racial segregation and institutional exclusion. However, the steady decrease in acquisition delay over time indicates that museums have become more responsive to recognizing and collecting Black art in recent decades. While this reflects progress toward greater inclusion, the data also highlights how institutional recognition has historically lagged behind artistic production.
Pie Charts
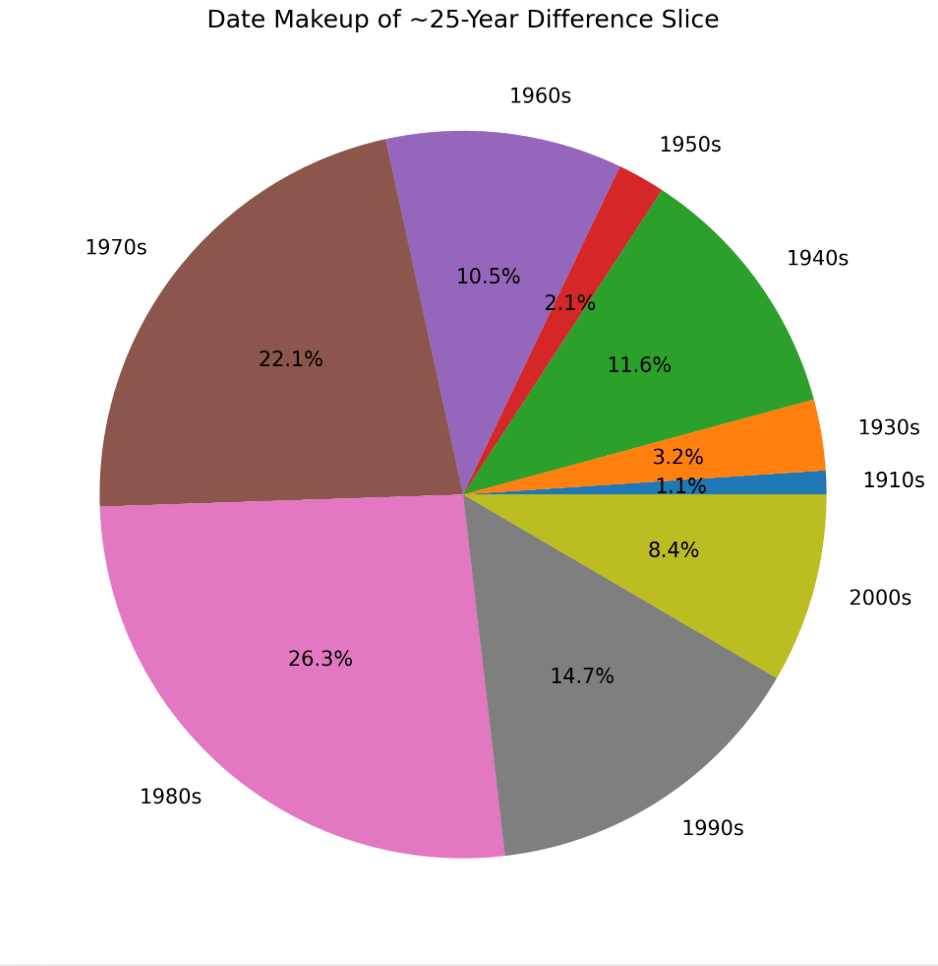
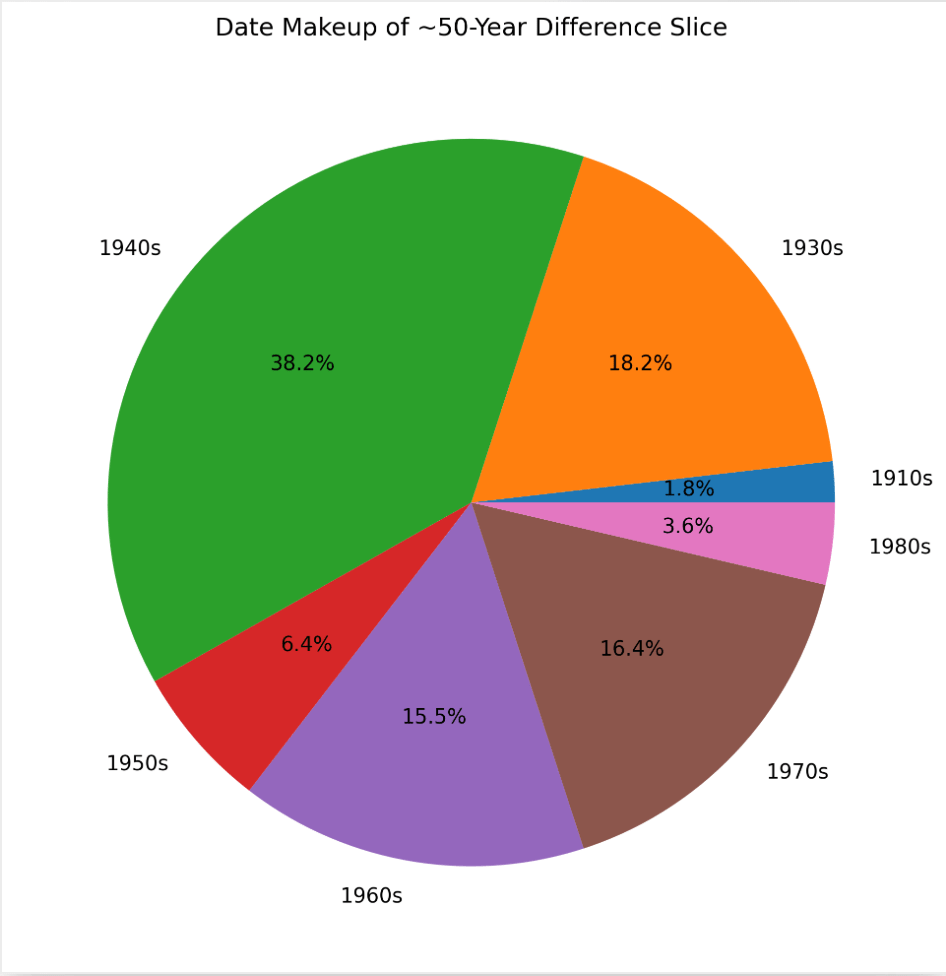
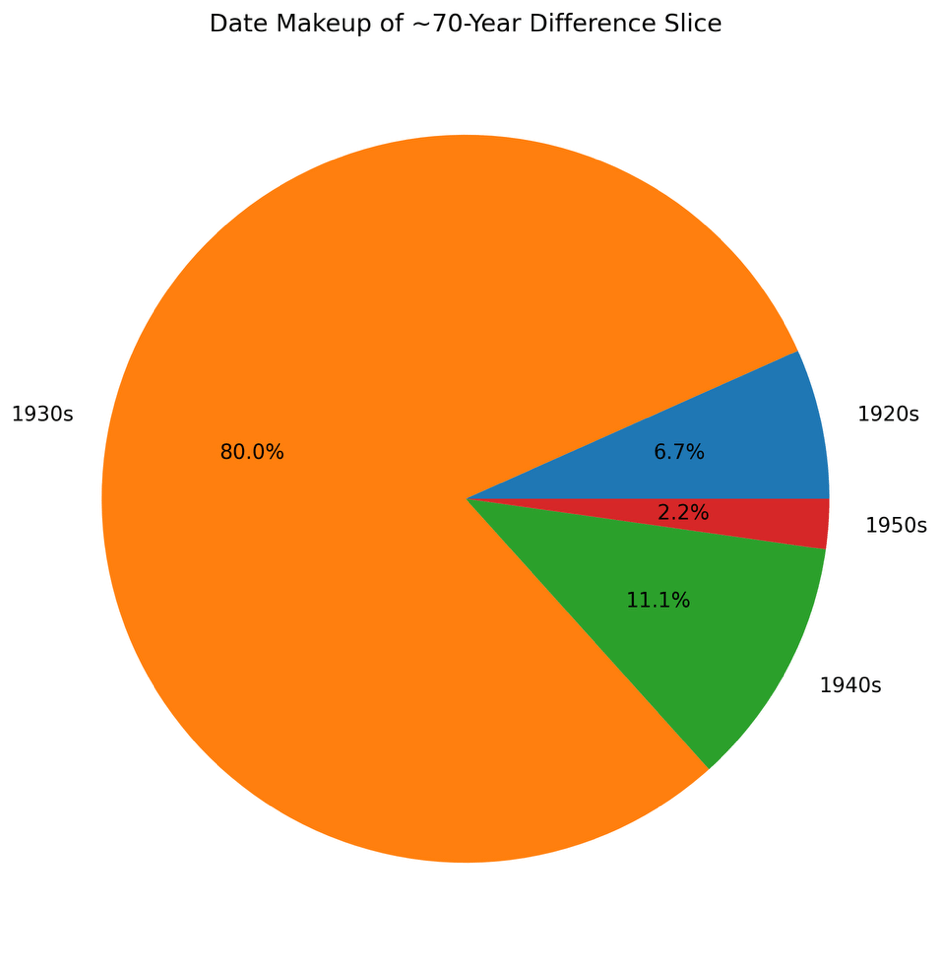
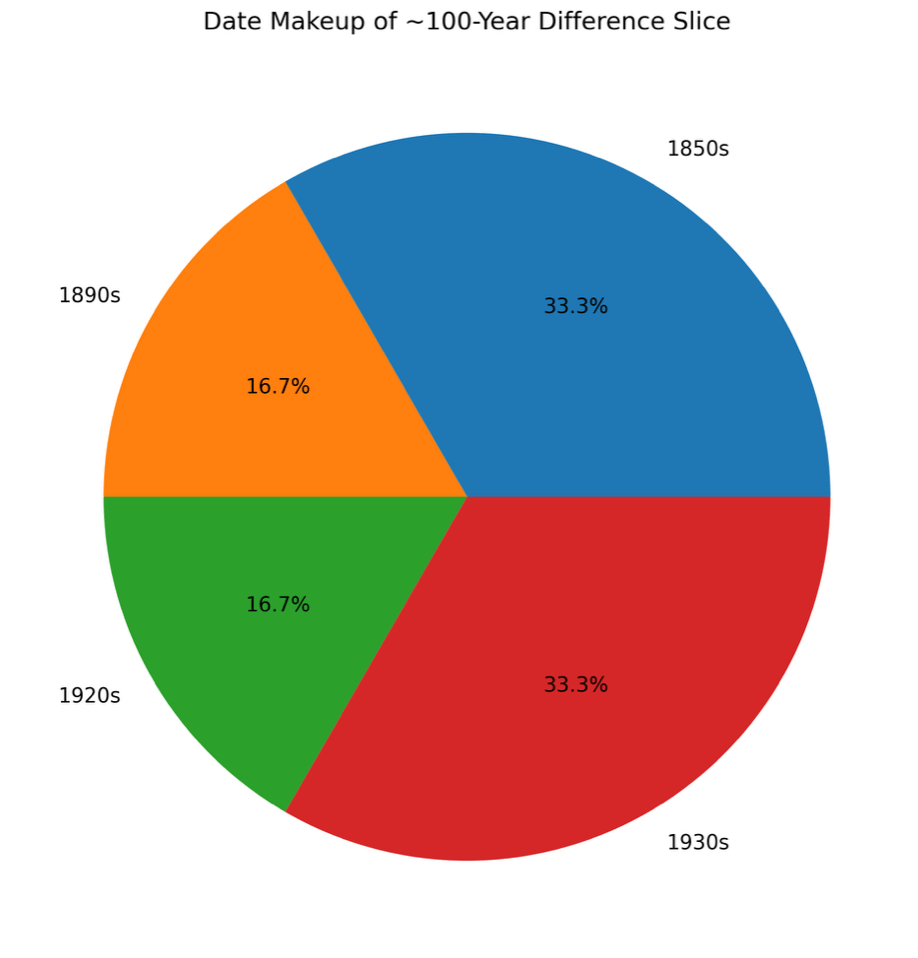
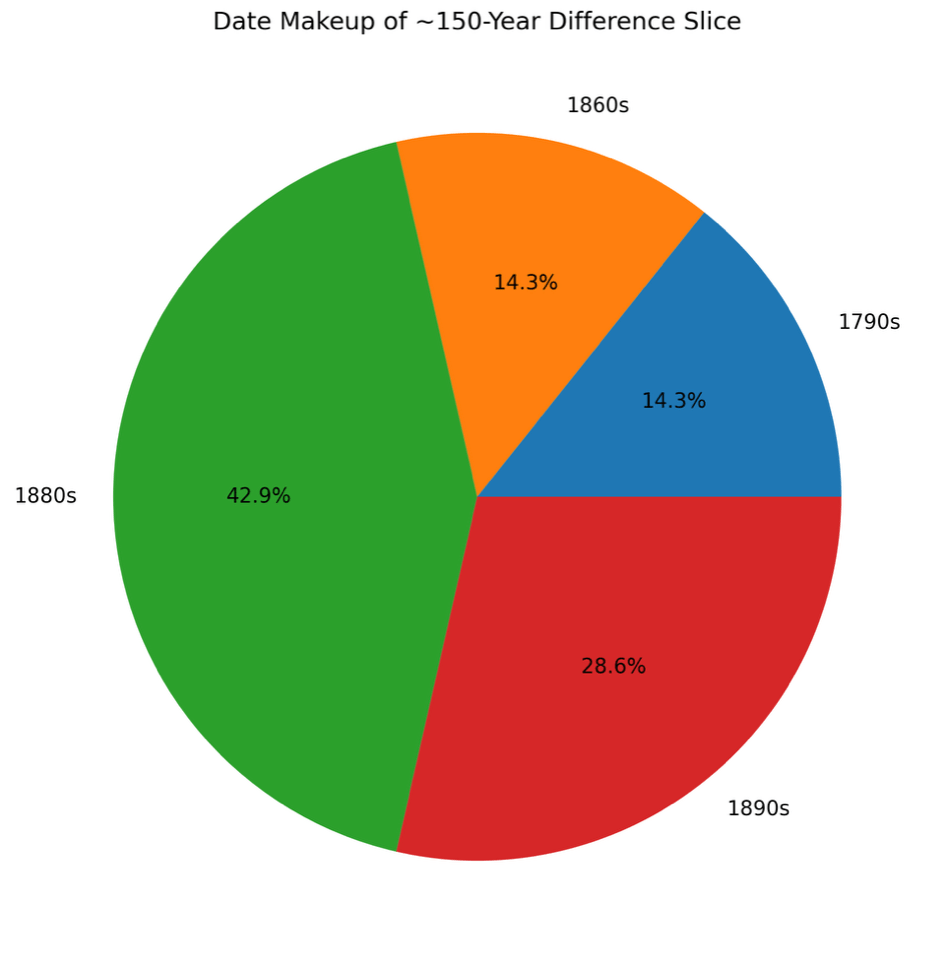
Pie Chart #1
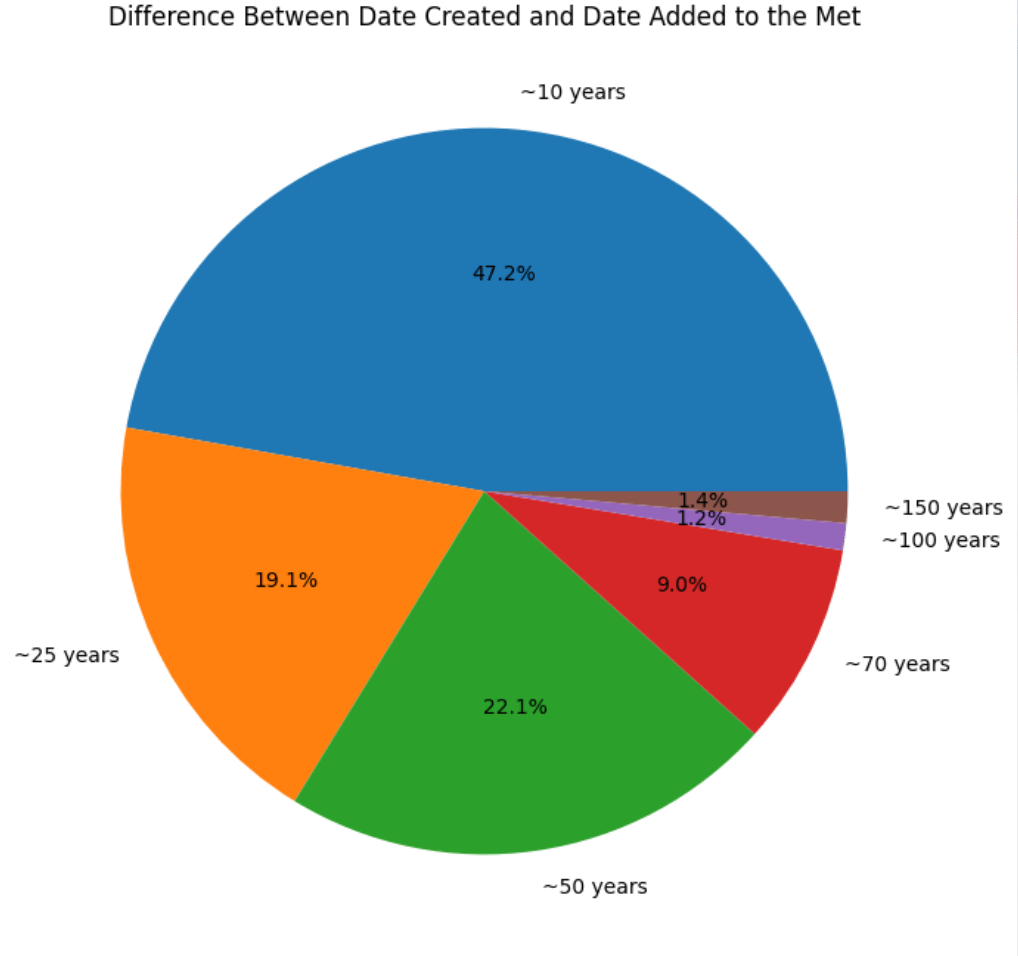
This pie chart visualizes the approximate acquisition delay between the creation of artworks by Black North American artists and their addition to the Metropolitan Museum of Art collection. Each slice represents a range of time differences — from works acquired within about 10 years of their creation to works acquired more than a century later — revealing how institutional recognition shifted across historical periods.
Pie Chart #2
This chart contains the largest acquisition delays in the dataset, including artworks created in the 19th century that entered the Met more than a century later. Many of these works were produced during Reconstruction and the rise of Jim Crow segregation, making the delays especially significant in understanding how Black artists were historically excluded from museum recognition and preservation.
Pie Chart #3
This chart represents some of the most extreme cases of delayed recognition, including works created during Reconstruction and the post-slavery era that were not acquired until the late 20th or early 21st century. These gaps reflect the long-term effects of racial exclusion within institutional collecting practices.
Pie Chart #4
This chart shows artworks acquired approximately 70 years after their creation, with most originating from the 1930s and 1940s during segregation and the Harlem Renaissance era. These long delays demonstrate how Black artistic achievements were often overlooked institutionally even during periods of major cultural innovation.
Pie Chart #5
This chart highlights artworks that experienced acquisition delays of about 50 years. Many works in this category were created during the Jim Crow and early Civil Rights eras, a period when Black artists were frequently excluded from major museums, galleries, and collecting institutions despite significant cultural and artistic contributions.
Pie Chart #6
This chart represents artworks acquired roughly 25 years after their creation, many of which were produced during the late Civil Rights and post–Civil Rights eras. These shorter delays suggest growing visibility and recognition of Black artists as museums slowly became more responsive to calls for inclusion and representation.
Pie Chart #7
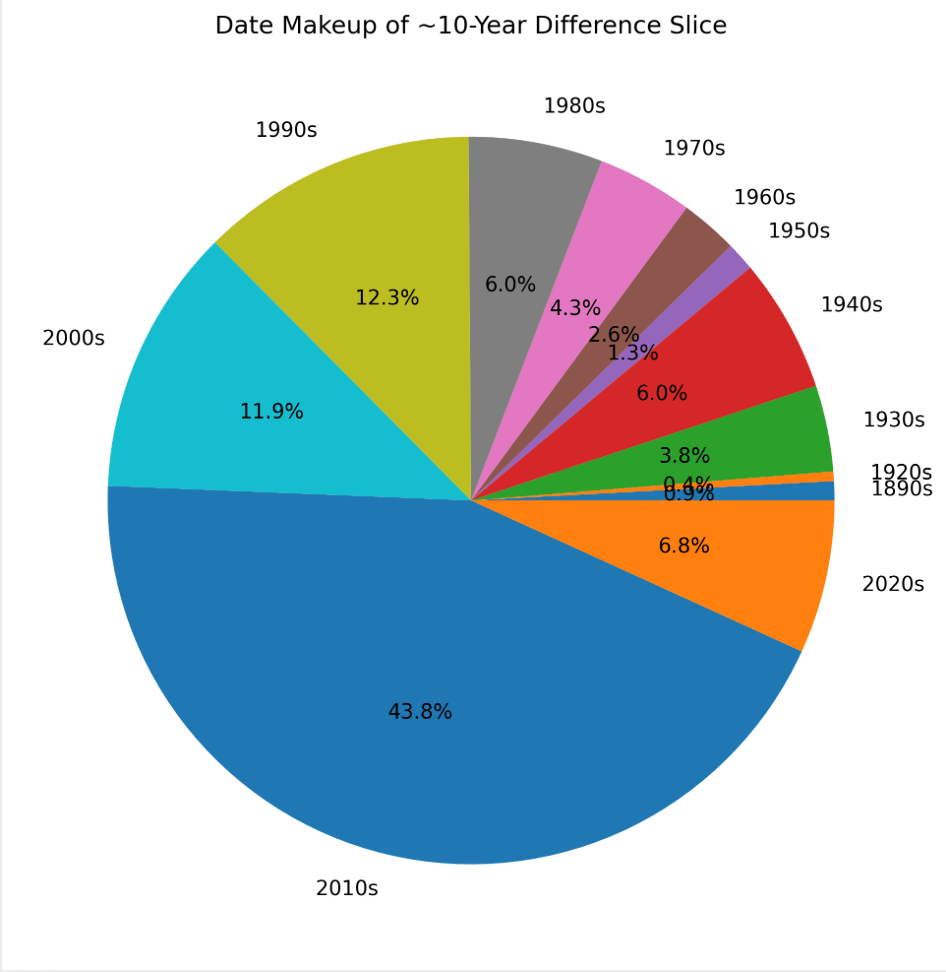
This chart shows artworks that entered the Met collection within approximately 10 years of their creation. Most works in this category were created after 2000, reflecting how contemporary diversity initiatives and increased institutional attention toward Black artists have reduced acquisition delays in the present era.
Analysis of Tableau Graph
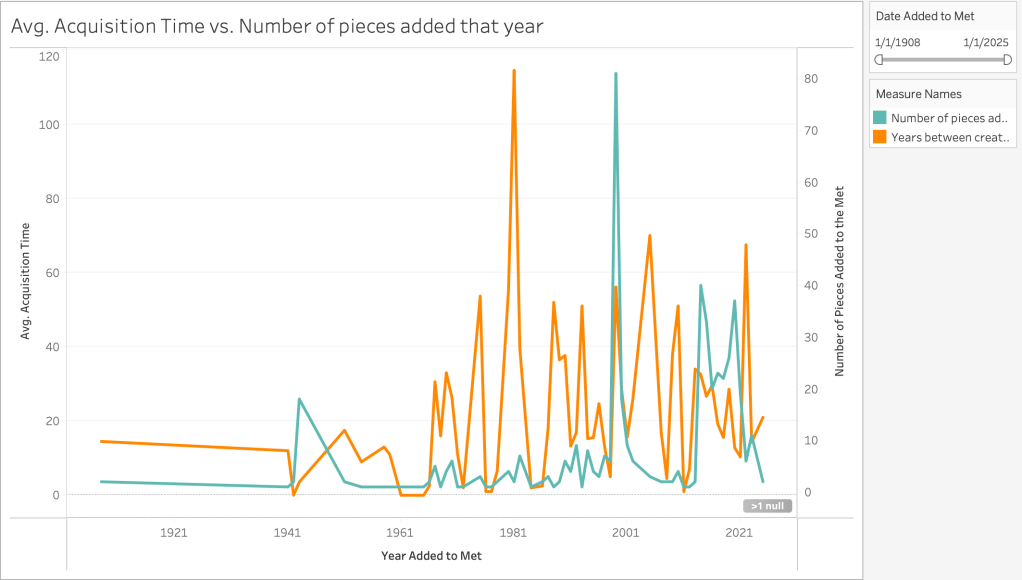
The graph above illustrates the relationship between how many pieces were added to the Met in each given year (blue) versus the average time it took to acquire those pieces since their creation (orange).
This is important to examine because it shows the vast discrepancies in acquisition times. We can look at specific years that stand out on the graph such as the large orange spike in 1981. There was an average of 114.5 years for acquisition but there were just 2 pieces added to the Met that year. Meanwhile a year like 1943 had an average of only 3.6 years with 18 pieces added that year. By investigating specific years, we can get a better understanding of general trends.
An interesting time span to look into is 2020. During this year, the Met acquired 37 pieces with an average acquisition timeline of 12.8 years. This seems to be a very strong year for the Met. We can dive deeper and look at the historical events that occurred during this year, the most notable being the George Floyd protests and the Black Lives Matter movement. With our data and this knowledge, we can infer that the Met was feeling a massive amount of social pressure to add more black artists to their collections to align with the ongoing movements. We can then look just 2 years down the timeline at 2022. They acquired just 6 works with an average acquisition time of 67. 5 years. These two years demonstrate the initial power of a social movement but how it lacked longevity for the field of art history, specifically for the Met.
Lastly, 1999 is the largest blue spike on the graph. It had 81 works added with an average acquisition time of 56.1 years. We can again look into the historical importance of this year to understand these numbers. Reba and Dave Williams are American collectors who built one of the largest private collections of American prints, with a major focus on 20th-century printmaking, including many black artists. In 1999, they donated about 200-204 prints, largely works by black artists. The Met did not primarily “discover” these works on its own, it received them through a private collection. The data point may seem to be a great initiative by the museum to include more black artists in their collection but with some research we learn about the large donation that makes 1999 a remarkable year.

